Boomi Cloud API Management Developer Blog
Next Generation Reporting Launched!
September 30, 2008
We are pleased to announce the launch of our Reporting 2.0 capabilities!
Our old system served our clients and Mashery well, but it was definitely starting to feel its age. As we got closer to this launch, it's been acting up on us as its final protest of its pending retirement. We will be raising a toast here in the office to the legacy system as we bid it farewell and welcome in the new.
We believe this new platform and the reports we've produced for our initial launch will be of great benefit to our clients as you embark on taking your APIs to the next level. You will find significant improvements in the data we collect, the types of charts, the ability to drill into some developer details, and just the visual appeal of the new pages. Our hope is they will allow you to better support your developers, better mine business development opportunities, assist in business processes like billing, and focus your development efforts towards actual demand.
Some highlights of our new capabilities:
-
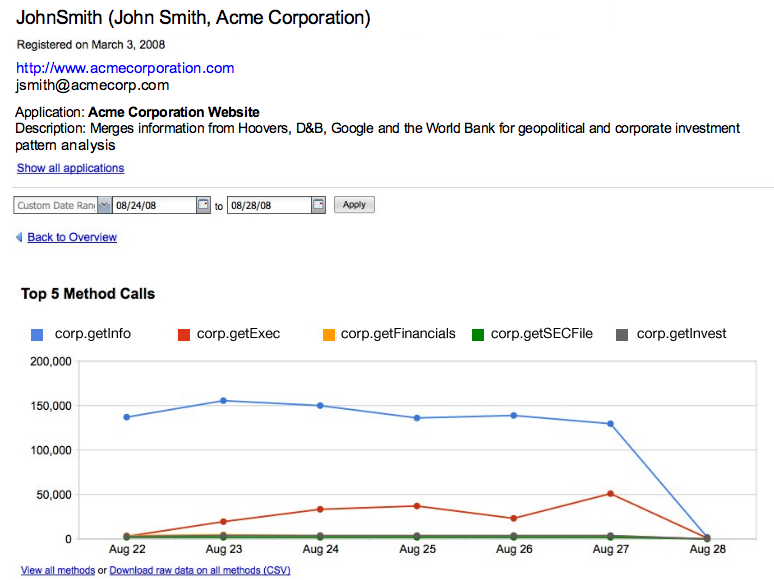
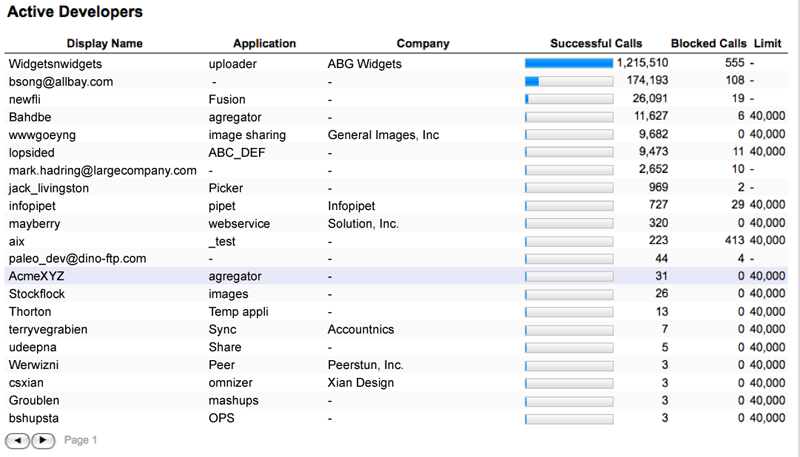
Developer Detail. Interested in what a specific developer is up to? Drill into the developer to see their application registration details alongside of charts for their volumes, error code counts, and top methods.
-
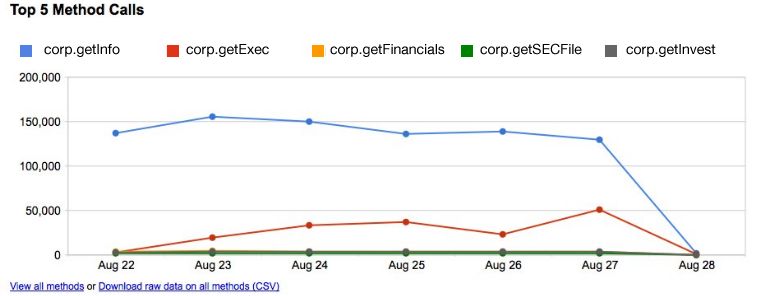
Method Level Detail. You may now review the methods your developers are calling as we have a Top 5 Methods chart both at the API and Developer levels.
-
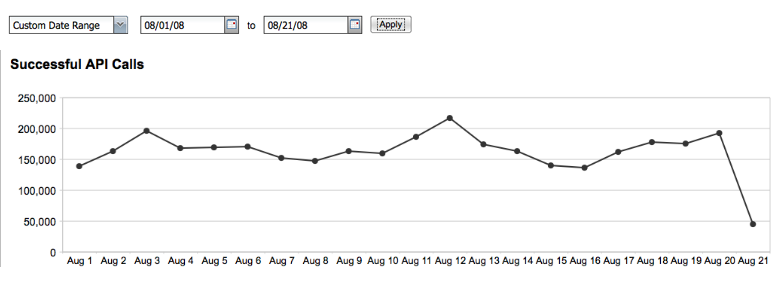
Flexible Date Ranges. Previously, we were limited to specific dates or week long date ranges. In this version, pick your own ranges, or select by date range templates like "Last Quarter" or "Last Month".
-
Near Real Time. Previously, calls from today would first show up the following day, and weekly reports were run on the weekends only. In this version, reporting data is continually indexed, getting close to 15-30 minute lag times. It really just depends on how much data we're crunching.
-
Extraction to CSV. All charts have a download to CSV link. Most will return full details relevant to that chart. For example, the Top 5 Methods chart returns data for all methods and their volume counts.
- Data as of July 1, 2008. The reporting system has data starting from Q2 2008, or July 1, 2008.
In addition to how excited we are about this release, we're equally pleased with how the architecture came together. We'll be able to add new charts easily and in the near future, produce custom reports/charts for our clients. On that note, tell us what you think of this release. What did we do well? What did we miss? What should we focus on next? Post your ideas or feedback into our forums.
For those of you that see less than meaningful method level charts, contact your Client Services Manager or support@mashery.com to work with us to configure your API proxy to index the appropriate data.